
Highlight Dabbles
For Illustration Purposes Only
All informational data below has been anonymized and or is mock data.
PE Firm Stakeholder -
Monthly Business Review
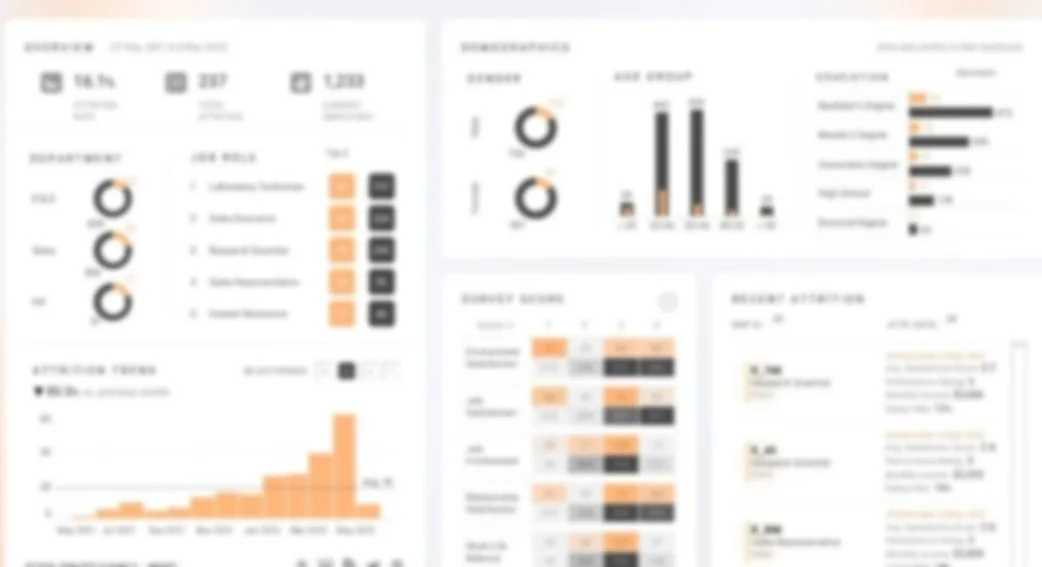
Interactive Dashboard
Consumer Beverage company in a PE firm portfolio
Monthly Board Review (Actuals thru Mar ‘26)
Financial Performance & Forecast Command Center
Internal Corporate Finance Advisory Platform — Advanced Operational Analytics Showcase
Vantage Period: October 2025
Multi-Year Net Revenue & EBITDA Trajectory (Jan 2024 – Dec 2026)
FP&A Presentation Guidelines: Dash lines transition exactly at the October 2025 boundary layer mark. Solid tracks signify realized historical reporting; dashed segments denote forward-looking forecasting matrices.
Three-Statement Master Ledger — Dynamic Consolidation
| P&L Line Component | FY24 Actual | YTD Sept-25 Act | Q4-25 Forecast | FY26 Pro Forma | Variance % |
|---|---|---|---|---|---|
Gross Revenue
i
Revenue Sub-breakdownEnterprise Core: $28.5M
Mid-Market: $11.2M
Professional Services: $3.15M
|
$51,200,000 | $42,850,000 | $13,200,000 | $61,400,000 | +4.2% |
Cost of Goods Sold (COGS)
i
COGS Cost ElementsHosting Infrastructure: 54%
Direct Support Labor: 31%
|
-23,910,000 | -19,580,000 | -5,940,000 | -27,130,000 | -2.1% |
| Gross Profit | $27,290,000 | $23,270,000 | $7,260,000 | $34,270,000 | +5.8% |
| Consolidated EBITDA | $11,790,000 | $10,300,000 | $3,240,000 | $16,870,000 | +7.4% |
AR Aging Mix (Treemap)
Customer Concentration Share (Treemap)
Key Account Sub-Ledger Balances
| Account Profile | Balance | Status |
|---|---|---|
Global Logistics
i
Account Deep-DiveCredit Limit: $1.5M
Avg Pay Cycle: 32 Days
|
$945K | Current |
| Vanguard Tech | $520K | Current |
| Apex Supply | $380K | 31-60d |
Headcount Capacity Roll-Forward & Efficiency Metrics
Efficiency Projections
Rev Per Operating FTE
$245.4K
▲ +5.4% Optimizing