
Dashboards + Business Intelligence (BI) examples

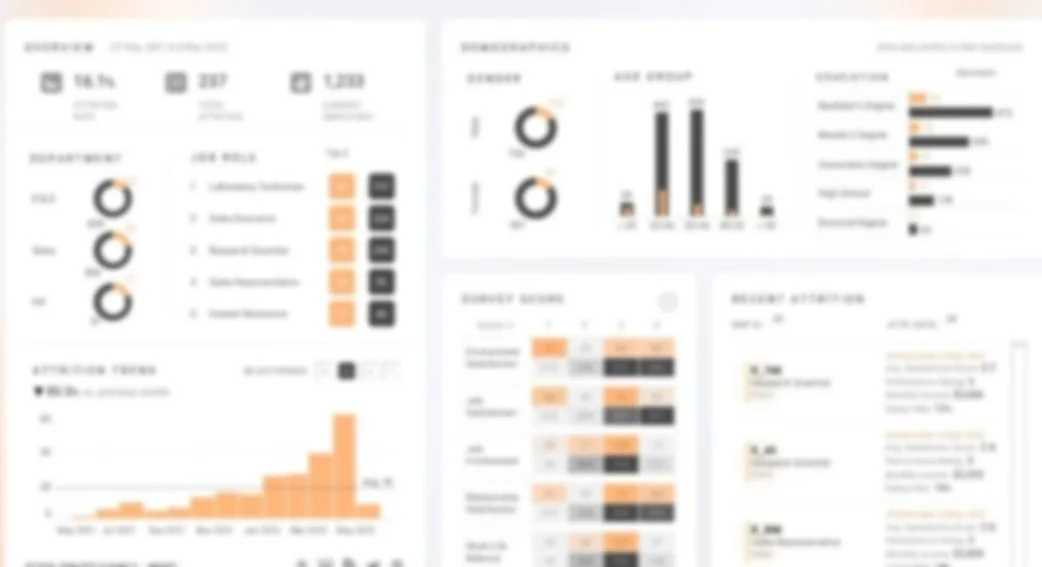
Interactive examples illustrating approach, technical scope, and insight visibility. Pairing traditional Extract, Transform, Load (ETL) pipelines with AI-driven schema mapping and semantic modeling to optimize data workflows into self-service Business Intelligence (BI) platforms.

For illustrative and demo purposes only using mock data.
Best viewing experience on a Desktop screen versus mobile device.


Global Manufacturer Corp R&D SBU Division

PE Firm Monthly Business Review

Supply Chain - Scenario Model

Corporate FP&A Management


Global Manufacturer Corp
R&D SBU Division
New Product Development

  • Interactive Dashboard

  • $122M R&D Strategic Business Unit with 45 New Product NPD/NPIs Status annual for FY25

  • BI Reporting Pack Output

  • Program Portfolio Explorer - Filtering by Segment and Gate Phase
    (Concept, Planning, Development, Testing, Launch)

  • Spend vs. Target > Material Cost and Resource Utilization by FTEs

  • Click on each card for more detail


Global Mfg Corp — R&D SBU Executive Financial Dashboard
BI Reporting Environment Scope: $122.0M Portfolio

Global Mfg Corp — R&D SBU Executive Summary

Total SBU Portfolio

$122.00M

100% Active Cap Plan

NPD Allocations

$71.85M

25 Programs 58.9% Total SBU

NPI Allocations

$50.15M

20 Programs 41.1% Total SBU

SBU Burn Variance

-$2.12M

-1.73% Favorable Under

Active Headcount

342 FTEs

190 Eng FTEs Utilized Cap

Cumulative Spend Track vs. Target Plan (FY 2025)

Illustrating monthly burn profile across R&D operations

Actual Spend
Planned Target

Portfolio Health & Gate Status

Total Program Count in each Risk Segment Profile

31
On Track
11
At Risk
3
Delayed

Dynamic Financial Narrative

Execute immediate Gemini AI audit mapping variance risk profiles across active R&D SBU projects.

Critical Variance Operations (Top Program Overruns / Underruns)

Flagged programs requiring executive alignment, status revisions, or scope audits

ID Program Designation Primary Segment Development Gate Planned Budget Actual Burn SBU Margin Var Status Indicator
NPD Segment

NPD-A01 Generation X Turbine

Gate Phase
Gate 3: Development
On Track
Spend vs. Target Plan Progress 98% Burned
Actual Cost
$2.15M
Target Budget
$2.12M

Material Cost Profiles

Dedicated Material Costs $562,000

Resource Utilization Profile (Active FTEs)

Designers & UX Architecture 2 FTEs
Core Research & Engineering 5 FTEs
SBU Marketing & Strategy 1 FTEs
Manufacturing Integration 3 FTEs

R&D Roadmap Allocation

Cycle Start: Q1 2024
Target Launch: Q4 2026
File successfully saved
Data compiled for active sheets.